m (Reverted edits by Awesomesix (talk | block) to last version by Minipop56) |
No edit summary |
||
| Line 1: | Line 1: | ||
| − | Distribution describes how data is distributed throughout a graph. There are some problems in relation to this which will be shown here |
+ | Distribution describes how data is distributed throughout a graph. There are some problems in relation to this which will be shown here one day. |
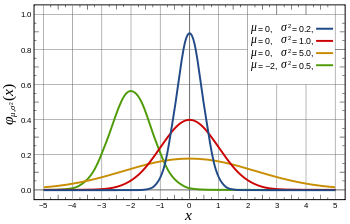
==Normal Distribution== |
==Normal Distribution== |
||
[[File:350px-Normal_Distribution_PDF.svg.png|thumb]] |
[[File:350px-Normal_Distribution_PDF.svg.png|thumb]] |
||
Revision as of 22:26, 14 February 2014
Distribution describes how data is distributed throughout a graph. There are some problems in relation to this which will be shown here one day.
Normal Distribution
Normal distribution is a pattern in data. It is when the data is distributed around the average regularly, which when plotted as a histogram (a graph) will result in a bell curve. In a Gaussian distribution, data tends towards the mean which means that the closer a value is to the mean, the more regularly it will appear. Essentially, Gaussian distribution is based on a 'bell curve'. Thus, in this "normal" distribution, the top of the bell is the mean.
Bimodal Distribution
In statistics, a bimodal distribution is type of distribution with two different modes. These are two different and distant peaks, and in these cases, generally, there are two "bell shapes". An example of this would be for finding the mean of a test. If a lot of people got a high test result, and yet a lot of people got a low test result, then the average would be between them, even though very little people probably got the average.